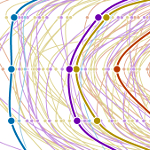
Drifting Apart
The partisan divide between rural and urban Nebraska
This visualization plots county-level presidential election results from 1980 to 2016, revealing a growing partisan divide between Nebraska's two largest metro areas – Omaha and Lincoln – and the rest of the state. This trend is not new, but 2016 pulled the state's rural and urban voters in opposite directions, leaving the largest partisan divide in 10 presidential elections.
DOWNLOAD CHART (.pdf)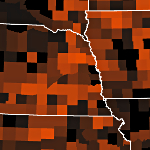
Tornado Seasons
A nationwide visualization of tornado reports
This visualization uses every reported tornado in the continental United States from 1951 to 2015. The animation includes one frame for every calendar day. Counties are shaded by tornado reports per square mile in the seven days around each day. This rolling average creates a smoother animation, illustrating how different regions of the country experience their own peak tornado seasons.
PLAY VIDEO (.mp4)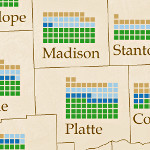
Nebraska Cropland
Changes in the state's major crops since 1909
One hundred years ago, wheat and oats were common across much of the state, and soybeans were barely grown at all. Before the increased use of irrigation, hay was the best use of land for many central Nebraska counties. These two maps highlight the changes in Nebraska cropland over the past century.
The acres of major crops on these maps account for about 98 percent of the total acreage of cropland recorded in the 1910 and 2012 Censuses of Agriculture.
DOWNLOAD MAP (.pdf)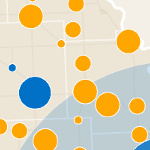
Nebraska's Last 50 Years of Urbanization
Growth & decline among Nebraska cities & towns, 1960 to 2010
Urbanization is such an old process in Nebraska that we often fail to appreciate its scope and scale. This map describes the dramatic population shift in only the past 50 years – well after the even larger changes experienced in the first half of the 20th Century.
Note that this map depicts changes in population counts for cities and towns, not percentage changes. Also note that it does not describe the relative drivers of these changes, such as in-state and out-state net migration and birth and death rates. Safe to say all of these factors have contributed to changes in Nebraska's human geography, and to what extents will be the subject of future maps.
VIEW MAP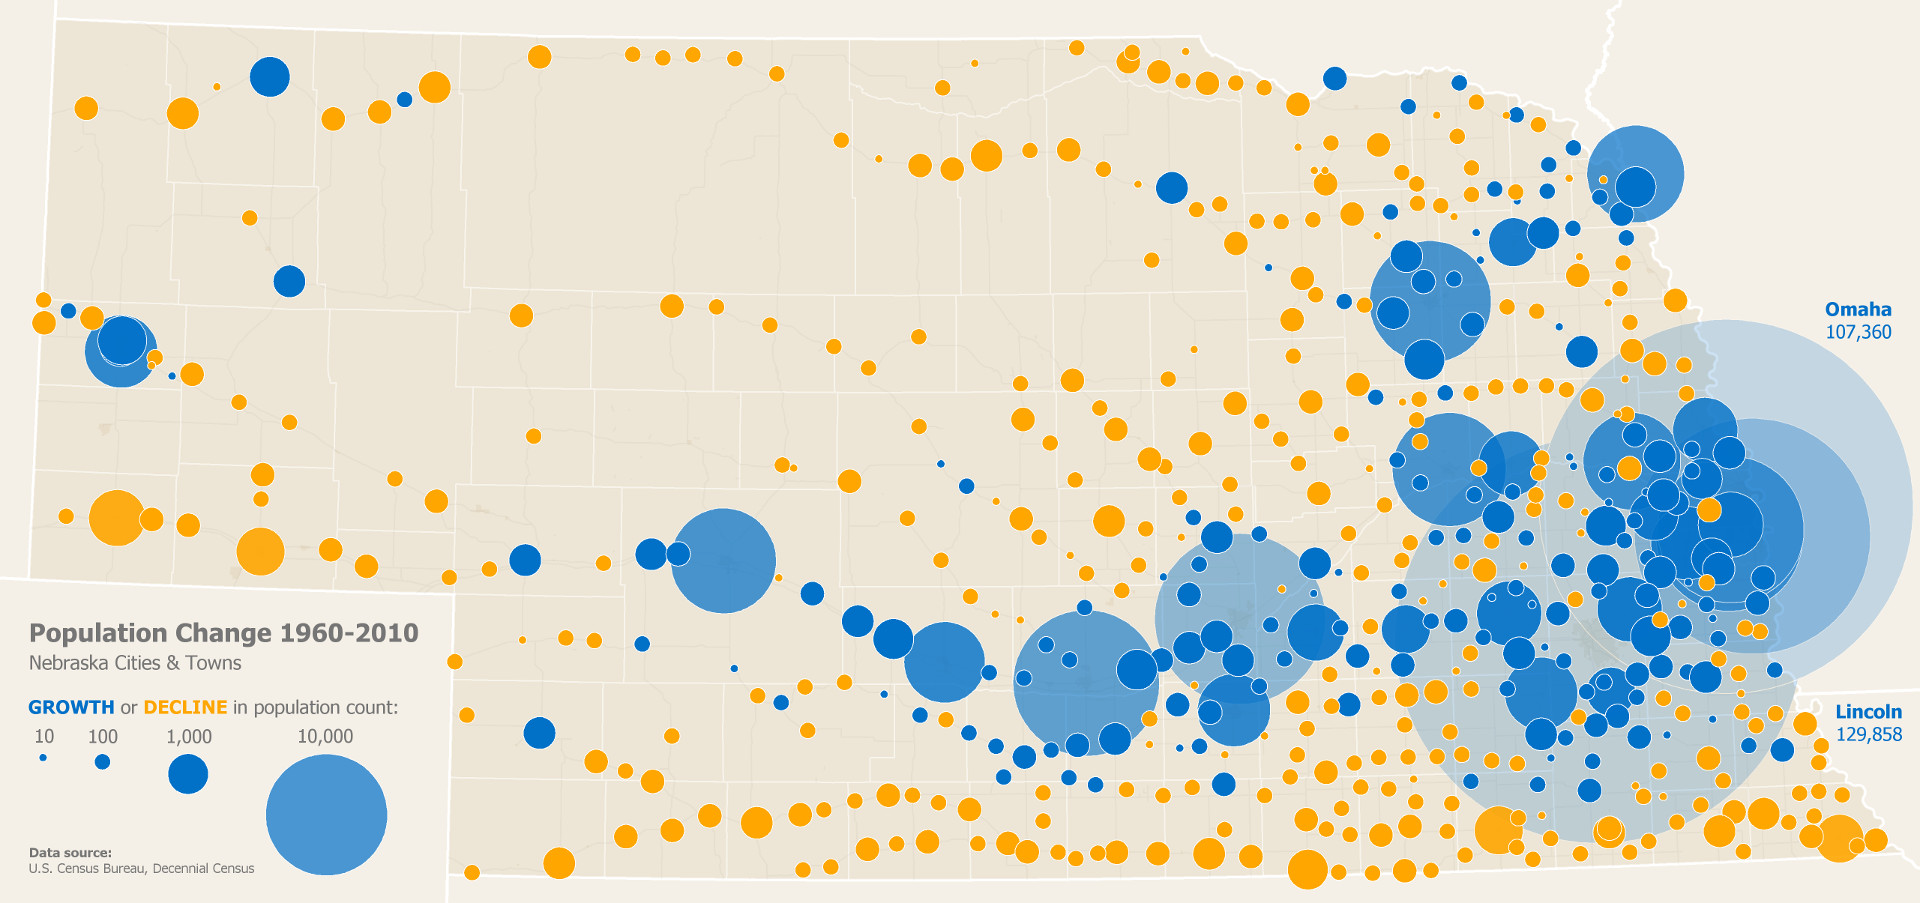